Master Google’s PMax Channel Performance Report
▼ Summary
– Google has introduced a new Channel Performance report for Performance Max campaigns, addressing long-standing advertiser demands for greater transparency into channel performance.
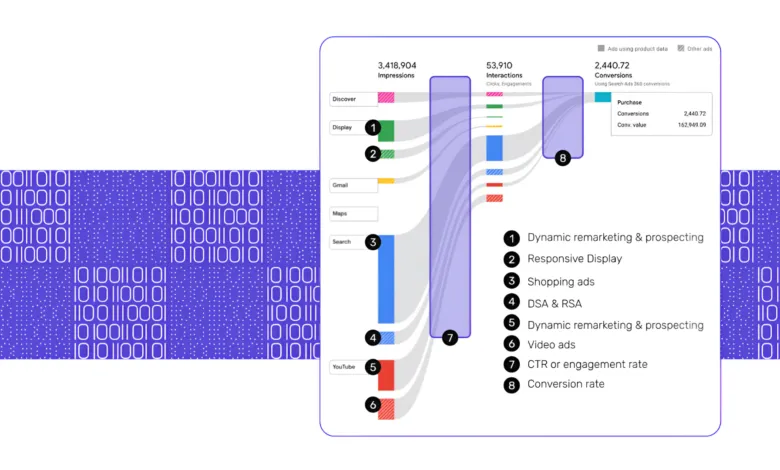
– The report provides both an account-level summary table and a campaign-level view with a detailed data table and a Sankey diagram visualizing the customer journey.
– A key feature is the ability to segment performance data between feed-based ads (like Shopping ads) and asset-based ads, as well as between click-through and view-through conversions.
– The report has significant limitations, including a visually misleading Sankey diagram and a data table that lacks essential calculated metrics like conversion rate and cost per click.
– Despite its flaws, advertisers can use the report’s export function for deeper analysis and should focus on monitoring traffic quality through placement data while awaiting future enhancements like API access.
For years, digital marketers have viewed Google’s Performance Max as something of an enigma. Its automated power delivers strong results, yet the inability to see exactly which channels drive those results has been a major point of contention. The introduction of the Channel Performance report directly addresses this core frustration, offering a native look into the network breakdown of your PMax campaigns. This represents a meaningful shift toward the transparency professionals have long requested.
This report functions as a pre-built network analysis, accessible within the Google Ads interface. It provides both tabular data and an interactive flow chart, tracking performance from impressions down to conversions. While it currently only supports Performance Max campaigns, indications point to future expansion to other campaign types. This is significant because all Google campaign types can serve across multiple networks, making this kind of visibility universally valuable.
Navigating the Report’s Two Key Views
The report is built around two primary perspectives: an account-level overview and a detailed campaign-level view.
The account-level table provides a compact summary for all your PMax campaigns. Each campaign is listed with nested rows for individual channels, complete with recognizable icons for easier scanning. You can sort by key metrics like cost or revenue to quickly compare performance distribution. Beyond the basics, the segmenting options unlock powerful insights. The “Ads using product data” segment finally allows a straightforward comparison between feed-based ads (like Shopping ads) and asset-based ads (like Responsive Display Ads). This cuts through previous guesswork about their respective performance.
Another crucial segment is “Ad event type,” which separates click-through conversions from view-through conversions. This lets you assess the volume and value of each, helping to answer ongoing debates about how view-through activity influences reported campaign success.
For deeper analysis, clicking on any campaign opens the dedicated campaign view. This page features a prominent Sankey diagram, a visual map of the customer journey, and a more detailed data table. While the Sankey is visually engaging, its proportions are not based on volume, making it misleading for quick analysis. The real analytical power lies in the table beneath it.
This campaign-level table breaks down performance by channel and ad type (feed vs. asset). A critical tip is to customize the columns to reveal hidden but essential metrics like Conv. value / Cost (ROAS) and Cost / Conv. (CPA), which are not shown by default. The table also supports exporting data for further investigation in spreadsheets.
Understanding the Data and Its Limits
Interpreting the channel labels requires some translation based on the feed/asset split. For instance, “Search Ads using product data” are your standard Shopping ads, while “Search Other ads” typically encompass Dynamic Search Ads and Responsive Search Ads. Similarly, “Display Ads using product data” often refers to Dynamic Remarketing ads.
Despite being a welcome tool, the report has notable shortcomings. Beyond the misleading Sankey diagram, the data table lacks fundamental calculated metrics like conversion rate and cost-per-click. To get a complete picture, you must export the data and perform these calculations yourself. Furthermore, some channel definitions remain vague, with Google providing limited documentation on what specific ad formats are included in each category.
Extracting Actionable Value
You can still derive significant strategic value by focusing on what the report does reveal: traffic quality. Since direct channel budget control is limited in PMax, use the insights to inform your asset strategy and placement exclusions.
Leverage the placement reports for Display and YouTube to see where your ads are actually showing. Export this data and use spreadsheet tools to translate foreign-language placements and categorize domains or video content for brand safety reviews. Exclude low-quality or irrelevant placements at the account level, prioritizing those with higher impression volume.
For advanced reporting, regularly export the Channel Performance data to Google Sheets. This allows you to calculate the missing metrics, build custom charts, and apply visual heatmaps. Community-built scripts can also enhance the native report by automatically adding metrics like CTR and CPC, applying clearer channel labels, and creating proportionally accurate visualizations.
The Path Forward for PMax Transparency
Google has signaled that more features are coming, including API access, manager account (MCC) level reporting, and likely support for Search Partner data and other campaign types like Demand Gen. The very existence of this report shows a responsive shift from Google. However, better visibility does not equal better decisions. The responsibility for insightful interpretation and strategic action based on this data remains firmly with the advertiser, marking a new phase of informed optimization for automated campaigns.
(Source: Search Engine Land)