Craft PPC Reports Your Clients Will Actually Read

▼ Summary
– Client retention depends more on service quality and communication than on results alone, with reporting being a critical touchpoint that shapes client perception.
– Effective reports must follow three key principles: simplicity (clear structure focused on client KPIs), insight (actionable analysis from data to recommendations), and context (historical and benchmark comparisons).
– Reports are formal, periodic documents with commentary, while dashboards provide real-time data with minimal analysis, though modern tools often blend both formats.
– Simplicity in reporting involves designing for client needs, focusing on key metrics, organizing by concept, and including a summary page to avoid overwhelming readers.
– Providing context through historical performance (month-over-month and year-over-year trends) and industry benchmarks makes data meaningful and helps clients evaluate results effectively.
Building a PPC report that your clients will genuinely read and value is less about data dumping and more about strategic communication. The strength of your client relationships often hinges on the clarity and usefulness of your reporting, even more than the raw results themselves. A fantastic outcome can be undermined by a confusing or overwhelming report, making this a critical business function.
It’s useful to first understand the landscape of reporting tools. While the lines have blurred, a traditional report is typically a formal, periodic document like a PDF or slide deck, rich with analysis and commentary. A dashboard, in contrast, offers real-time data access through platforms like Looker Studio with minimal explanation. Many agencies now blend these, exporting dashboard snapshots and adding narrative to create a hybrid monthly report. Regardless of the format you choose, exceptional reporting consistently rests on three pillars.
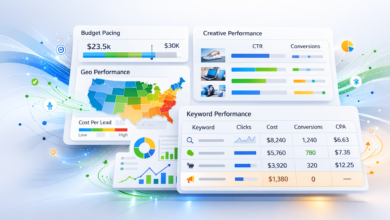
Simplicity is the first and most crucial principle. The goal is to transform complex data into an easily digestible format, avoiding what experts call “data puke.” Every design choice, from the layout to the graphs, should be guided by a desire for clarity. Achieve this by first designing for the client’s specific needs, not your own assumptions. A CEO requires different key performance indicators (KPIs) than a marketing manager. Focus relentlessly on the KPIs that matter most to the decision-maker. Structure the report around clear concepts, such as individual platforms or primary goals, and always include a summary page to give time-poor readers the big picture instantly. Professional branding adds a touch of polish that reinforces credibility.
Insight is what separates a simple data presentation from a valuable consultant’s report. It involves moving beyond the “what” to explain the “why” and the “so what.” A powerful framework to follow is: present the Data, state the Observation (what happened), provide your Interpretation (why it happened), and recommend an Action (what to do next). While automation can help with initial observations, the expert analysis behind interpretation and action remains irreplaceable. Limit each page to a single concept and no more than three key, actionable insights.
The final pillar is Context. Data without context is meaningless. A great report provides two essential types: historical performance and industry benchmarks. Showcasing month-over-month and year-over-year changes illustrates trends and is vital for businesses with seasonal fluctuations. Graphs that track performance over time make progress visually apparent. Furthermore, comparing your client’s metrics, like cost-per-acquisition, to industry benchmarks from sources like Google’s keyword tool or aggregators like Wordstream answers the critical question: “Are we doing well compared to our competitors?”
Getting started is more accessible than ever. Tools like Looker Studio offer numerous templates that can have you generating reports in minutes. The real key to success, however, isn’t the software but the strategy. By anchoring every report you create in the principles of simplicity, insight, and context, you transform a routine task into a powerful tool for client retention and growth.
(Source: Search Engine Land)