Google Search Console Now Supports Custom Report Annotations
▼ Summary
– Google Search Console now allows custom annotations directly in performance reports to add contextual notes to traffic data charts.
– Annotations mark specific dates with explanations for site changes, SEO work, or external events affecting search performance.
– All annotations are visible to everyone with property access, so sensitive personal information should be avoided in notes.
– This feature eliminates the need for separate documentation by creating an internal change log within performance reports.
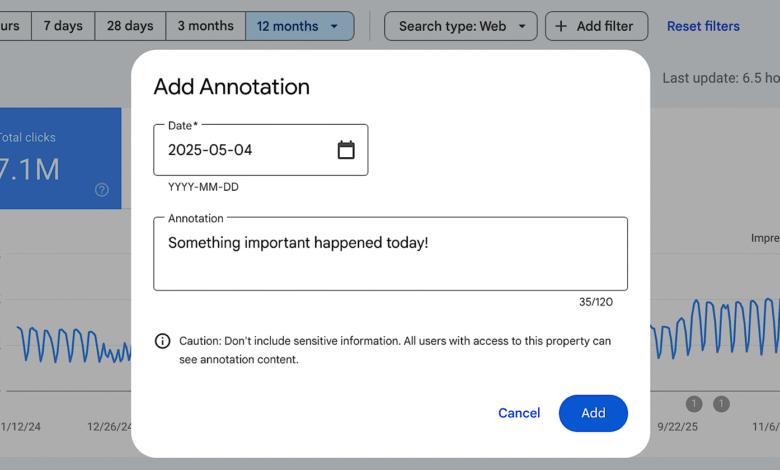
– Users can add annotations by right-clicking on charts, selecting the option, choosing a date, and entering up to 120 characters of text.
Google has introduced a powerful new feature within its Search Console performance reports: custom annotations. This tool allows website owners and SEO professionals to embed contextual notes directly onto traffic data charts, linking specific dates with events that influenced search performance. By right-clicking on any chart, users can now add short descriptions of site updates, marketing campaigns, or external occurrences, creating an integrated log of changes without needing external documentation.
The custom annotations appear as small markers on the performance graphs, making it simple to correlate traffic spikes or drops with particular actions. Common examples include noting infrastructure upgrades, content strategy pivots, major SEO initiatives, or external factors like holidays or industry events. Since every person with access to a Search Console property can view these annotations, it’s important to avoid including sensitive personal details. This shared visibility ensures that team members or clients have a unified understanding of what drove performance changes.
Before this update, tracking the reasons behind traffic fluctuations often required maintaining separate records or spreadsheets. Now, annotations serve as an internal change log directly within the performance reports you already monitor. For agencies managing multiple client accounts or in-house teams coordinating across departments, this feature provides a centralized record of releases, migrations, and campaigns. It eliminates the need to cross-reference external project management tools, streamlining workflow and improving collaborative analysis.
Using the feature is straightforward. Simply right-click on a performance chart, choose “Add annotation,” select the relevant date, and type in your note, up to 120 characters. The annotation then displays on the chart as a visual cue alongside metrics like clicks and impressions. This integration helps teams quickly recall why certain trends occurred, making performance review sessions more efficient and informed. Custom annotations are now fully available in Search Console, accessible directly through the chart’s context menu.
(Source: Search Engine Journal)