NASA: Solar Activity Is Increasing Faster Than Predicted
▼ Summary
– The Sun reversed a long-term decline in activity in 2008, shifting from a historic low to increasing activity.
– Solar activity fluctuates in 11-year cycles but also experiences longer-term variations that can last decades.
– Increased solar activity can lead to more space weather events like solar storms, flares, and coronal mass ejections.
– NASA tracks solar activity because it affects spacecraft, astronaut safety, communications, GPS, and power grids on Earth.
– The study used data from NASA missions like ACE and Wind to analyze solar wind and plasma parameters.
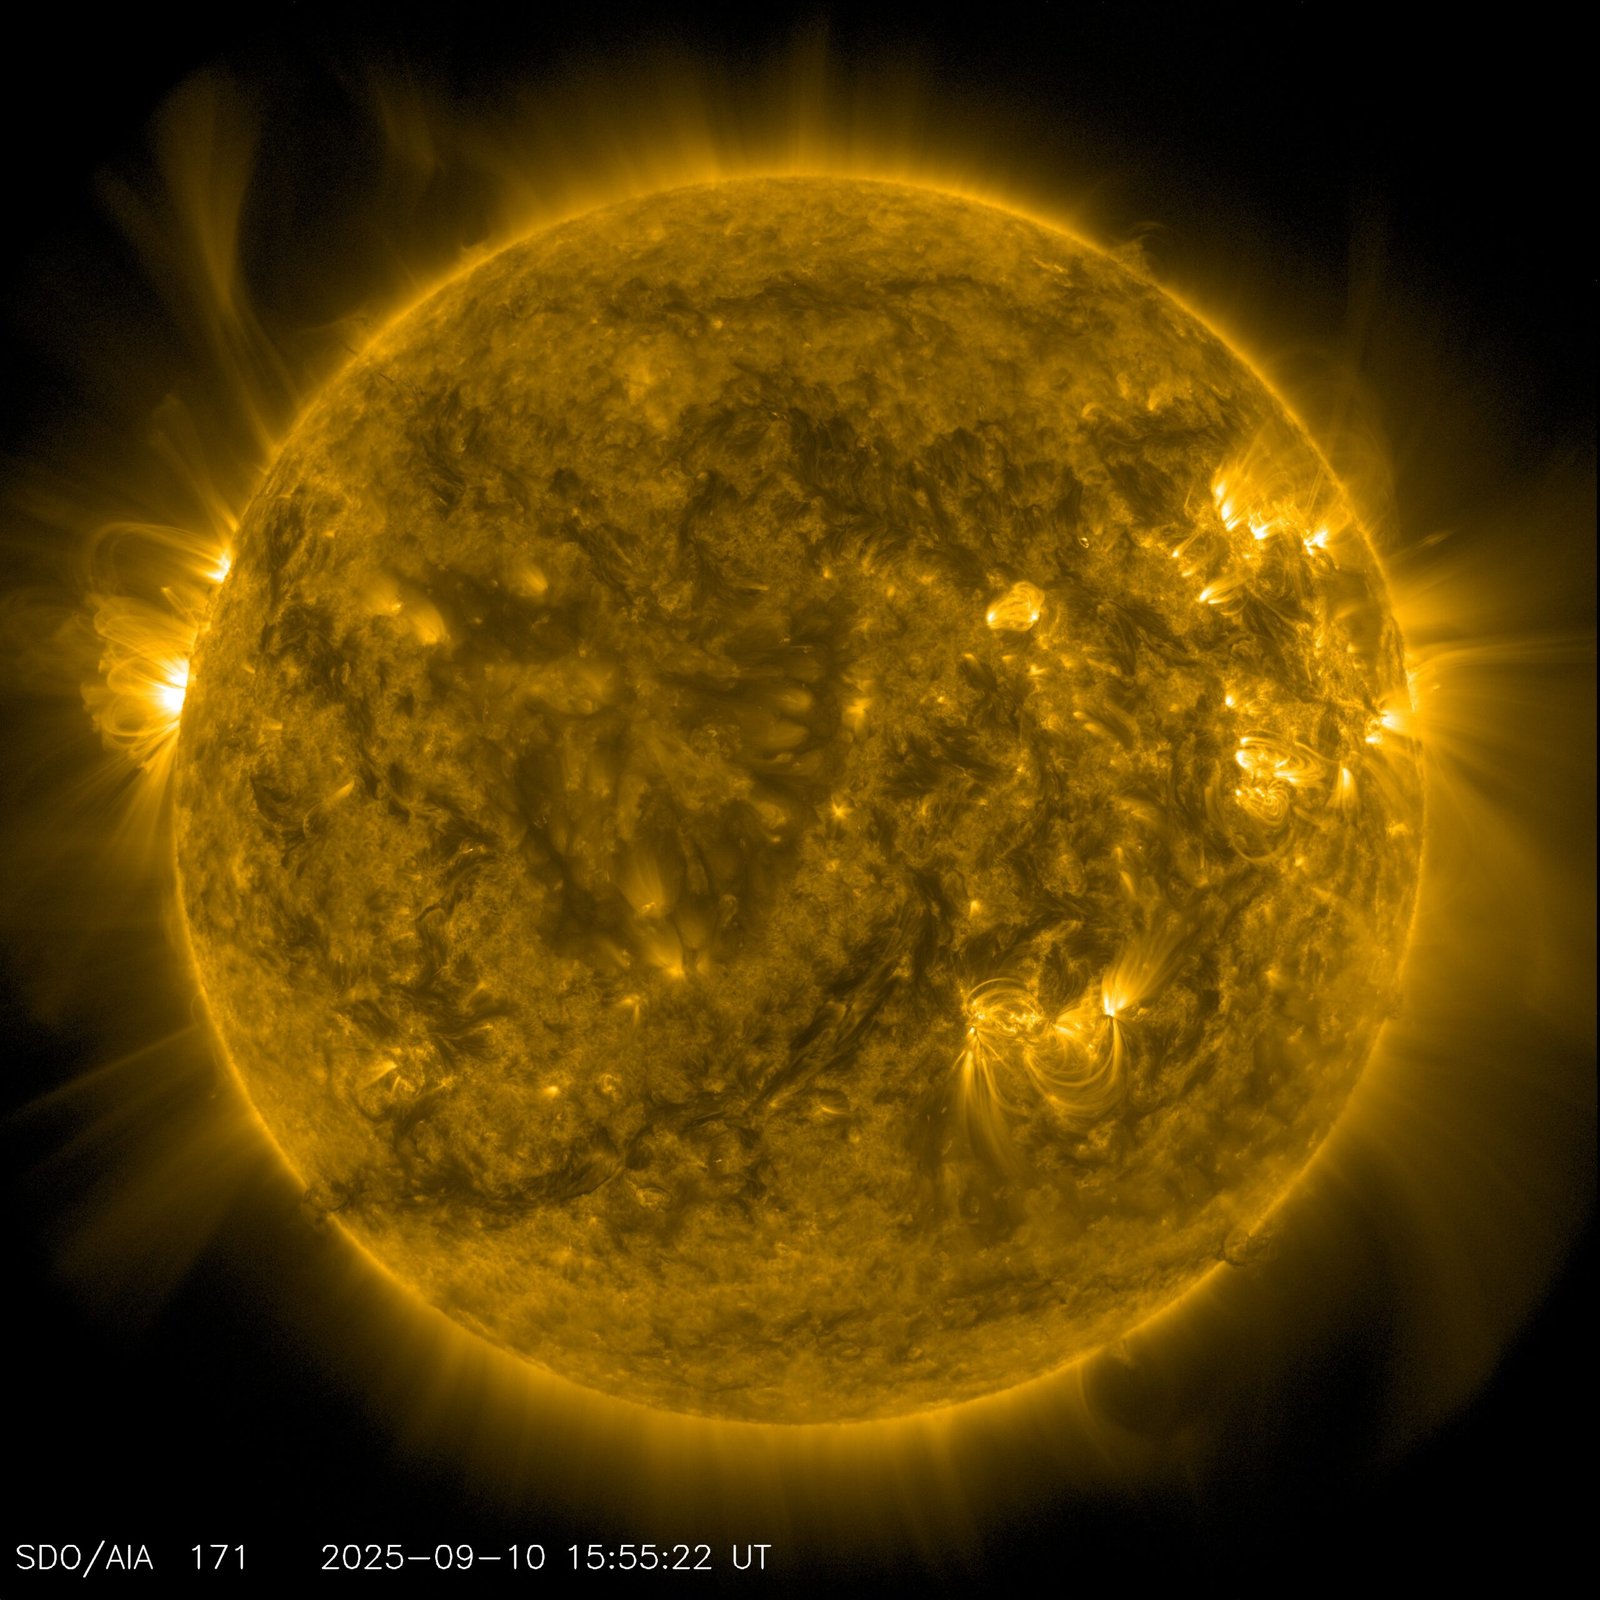
On September 9, 2025, NASA’s Solar Dynamics Observatory recorded a striking image of the Sun, revealing a significant shift in its behavior that has caught the attention of scientists worldwide. Solar activity is now increasing at a faster rate than previously anticipated, marking a notable reversal from the declining trend observed over recent decades.
For years, evidence pointed toward the Sun entering a phase of unusually low activity. That expectation changed dramatically in 2008, when solar activity reached its weakest recorded level, only to begin climbing again shortly afterward. A recent NASA-led study published in The Astrophysical Journal Letters confirms this unexpected turnaround, suggesting the Sun is gradually becoming more active rather than settling into an extended quiet period.
Jamie Jasinski of NASA’s Jet Propulsion Laboratory, the study’s lead author, remarked, “All indicators suggested the Sun was heading into a prolonged lull. Witnessing this reversal came as a genuine surprise. The Sun is slowly waking up.”
Scientists have monitored solar activity since the early 1600s, when astronomers like Galileo began counting and documenting sunspots. These cooler, darker regions on the solar surface result from concentrated magnetic fields and often coincide with heightened solar events such as flares and coronal mass ejections. Such phenomena can significantly impact technology and infrastructure, disrupting radio signals, GPS accuracy, power grids, and even endangering astronauts and spacecraft.
Understanding and predicting space weather has never been more critical, especially with NASA’s Artemis missions aiming to return humans to the Moon and eventually reach Mars. Upcoming missions like IMAP and the Carruthers Geocorona Observatory, along with NOAA’s SWFO-L1, will enhance our ability to monitor and respond to solar behavior, providing essential data for future exploration.
The Sun’s influence extends throughout the solar system, shaping the magnetic environments of planets like Earth. As solar wind and other activity intensify, the Sun’s magnetic reach expands, compressing protective magnetospheres that shield planets from harmful radiation. Historical records show extended periods of solar calm, such as the three-decade Maunder Minimum beginning in 1645 and a four-decade quiet phase starting in 1790. The reasons behind these long-term patterns remain poorly understood.
In the years leading up to 2008, sunspot numbers and solar wind pressure had declined so substantially that researchers anticipated a new historic minimum. Instead, solar wind parameters began to rise, and plasma and magnetic field measurements have continued climbing ever since. Jasinski and colleagues analyzed decades of publicly available data from NASA’s OMNIWeb Plus platform, drawing from missions like ACE and Wind, which have monitored solar particles and magnetic conditions since the 1990s.
This renewed solar vigor underscores the dynamic and sometimes unpredictable nature of our star. While the 11-year solar cycle is well-documented, longer-term trends remain challenging to forecast. Continued observation and research will be essential to unravel the Sun’s mysteries and prepare for its effects on human technology and exploration.
(Source: NASA)