Unlock IT & OT Observability with Open-Source Zabbix
▼ Summary
– Zabbix is an open-source monitoring platform that tracks the availability and performance of IT infrastructure, including networks, servers, applications, and cloud resources.
– It collects data from multiple sources via polling and trapping methods, supporting technologies like SNMP and IPMI, and presents it through a centralized web interface.
– The platform features a customizable alerting system with triggers based on thresholds and trends, enabling automated notifications and response actions for security and operations.
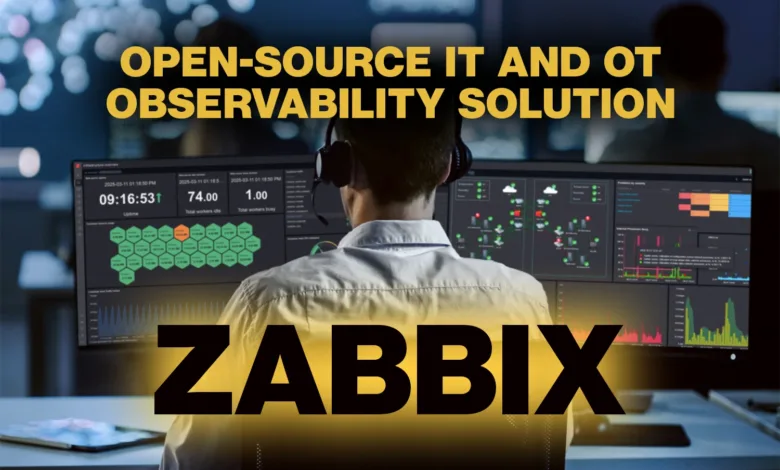
– Zabbix provides extensive visualization tools, including real-time graphs, dashboards, and network maps, to help teams analyze data and communicate system status.
– It offers web monitoring, network discovery, and an API for extensibility, along with access controls and proxy support for distributed environments.
For cybersecurity and IT operations teams, achieving comprehensive visibility across both information technology (IT) and operational technology (OT) environments is a critical challenge. An open-source monitoring platform like Zabbix provides a powerful solution, offering a unified view of networks, servers, applications, and cloud resources. This visibility is essential because performance anomalies and service failures are often the first indicators of a security incident, allowing teams to detect early signs of compromise through changes in system behavior.
The platform consolidates data from a vast array of sources into a single, web-based interface. This centralized dashboard enables personnel to assess the health and status of the entire infrastructure from any location. Zabbix scales effectively, supporting everything from small businesses with limited assets to large enterprises managing thousands of monitored devices.
Data collection is highly flexible, utilizing both polling and trapping methods. It integrates seamlessly with standard protocols including SNMP, IPMI, and JMX, and supports environments like VMware. Lightweight agents can be installed on systems running Linux or Windows, while centralized server and proxy components manage the aggregation of information. Teams can define custom collection intervals, allowing for more frequent monitoring of critical systems without imposing unnecessary load across the entire network. All historical data is stored in a database with configurable retention policies, facilitating long-term trend analysis and post-incident reviews.
The alerting framework is designed to enable rapid response. Notifications are generated by user-defined triggers that reference collected metrics, enabling the detection of problems based on evolving trends rather than isolated events. Alert customization is extensive, with options to tailor the recipient, delivery method (like email or SMS), and escalation schedules. Messages can include dynamic macro variables that provide immediate context, such as the affected hostname or the specific metric value that crossed the threshold. Furthermore, the system can execute automated actions, such as running remote commands, which in a security context could initiate containment procedures or enrichment workflows.
Visualization is a cornerstone of the platform. Monitored metrics are graphed in near real-time using built-in tools. Users have the ability to create custom graphs that combine multiple data streams into a single coherent view, which is invaluable for correlating activity across different services and systems. Beyond basic graphing, Zabbix offers network topology maps, customizable dashboards with slideshow capabilities, and detailed reporting features. These tools aid in capacity planning and help technical teams communicate system status and security postures effectively to management and other stakeholders.
Web monitoring capabilities allow teams to simulate user interactions by scripting navigation paths through a website. This checks for both functional correctness and response times, helping to identify service degradation or availability issues that might stem from attacks or configuration errors. Automated network discovery features reduce manual overhead by detecting new devices, file systems, and network interfaces. Agent auto-registration streamlines the onboarding of new assets, which is crucial in dynamic environments. The use of templates, which can inherit from one another, ensures consistent monitoring policies are applied uniformly across similar systems.
The platform is built with extensibility and security in mind. All configuration, reporting, and statistical data are accessible through a PHP-based web interface that includes comprehensive audit logging. A robust permissions system enforces role-based access control, enabling a clear separation of duties between security analysts, network operations, and other teams. For integration and automation, Zabbix provides a full-featured API, allowing it to connect with third-party security tools and orchestration platforms. Its core components are written in C for performance and portability, and its proxy architecture supports monitoring in distributed or segmented networks without requiring direct access to the central server.
(Source: HelpNet Security)